Time Attendance Dashboard (Daily View)
The Daily Attendance Dashboard gives HR admins a real-time view of the entire organization's attendance in one place; from how many employees have signed in, to analyzing absence trends over time.
Go to Dashboard > Time Attendance > Daily View
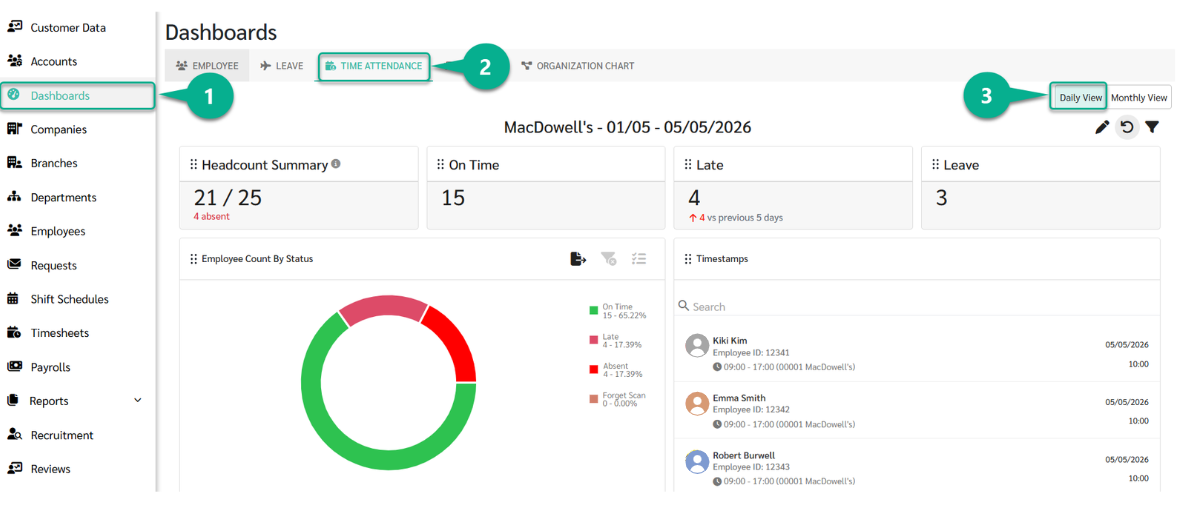
- See Time Attendance Dashboard (Monthly View) at LEARN MORE
1. Headcount Summary
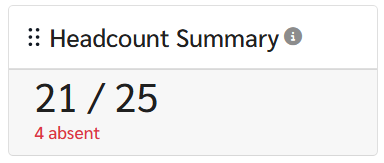
Displays attendance figures in the format X / Y · Z.
| Variable | Meaning |
|---|---|
| X | Number of employees who have signed in |
| Y | Number of employees expected to work today (excludes full-day leave, Day Off, and Holiday) |
| Z | Number of employees in Y who have not yet signed in (calculated directly from the Y base) |
Notes:
- Employees on full-day Leave, Day Off, or Holiday are excluded from Y but still appear in the Timesheet Table
- If the company has enabled "Set Public Holiday as Work Days" in the Calendar settings, Holiday is included in Y
2. KPI Cards
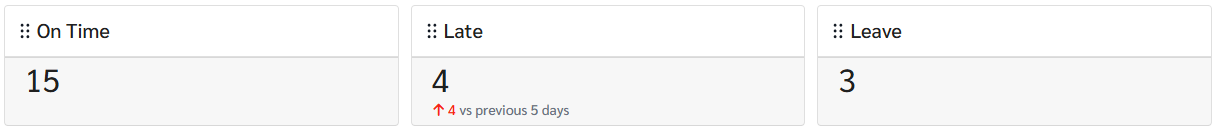
Each card shows the number of employees in that status for the selected date.
Notes:
- The Leave card counts full-day leave only. Employees on hourly leave are still expected to come to work and are not counted here.
- Violation cards (Late, Out Early, Forget Scan, Absent) show a comparison indicator displaying whether each status has increased or decreased compared to the previous period. For example, if the selected range is 1–30 April (30 days), the comparison covers 1–31 March (the 30 days immediately before).
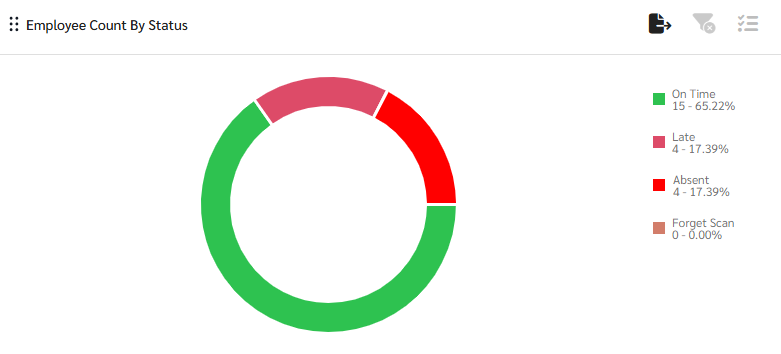
3. Employee Count by Status (Donut Chart)
- The donut chart shows the proportion of employees by attendance status for the selected date, giving an instant visual summary of where the workforce stands.
- Click on any status color in the chart to filter the Attendance Timesheet Table by that status. For example, clicking Late will show only employees who were late on that day.
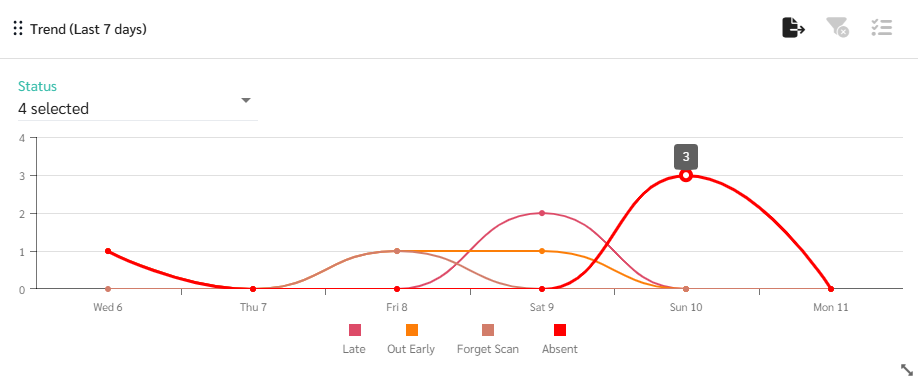
4. Trend Chart
Tracks attendance status trends over time, particularly Violation statuses (Late, Out Early, Forget Scan, Absent) to see whether things are improving or getting worse.
- Add or remove statuses using the dropdown
- Click a status on the chart to filter
5. Attendance Status Breakdown
Breaks down attendance statuses across four dimensions, each as a separate chart:
- Attendance Status by Department
- Attendance Status by Age Group
- Attendance Status by Gender
- Attendance Status by Nationality


Each chart has a multi-select dropdown to choose which statuses to display. Toggle "100% Stacked Bar" to switch between actual count and percentage view.
When to use each view:
- 100% Stacked Bar off
- compares actual numbers across groups. Useful for seeing which department or group has the most violations in absolute terms.
- Example: Both Kitchen and Guest Service have 2 absent employees, so their bars appear the same length.
- 100% Stacked Bar on
- compares proportions across groups, regardless of group size. Useful for identifying which group has the highest violation rate relative to its own headcount.
- Example: Even though both departments have 2 absent employees, Guest Service shows a longer absence proportion because its total headcount is smaller.
6. Attendance Timesheet Table
The Attendance Timesheet Table shows each employee's daily attendance record, what time they signed in and out, and their status for that day.
- Search and filter the same way as other data grids in the system
- Export to Excel
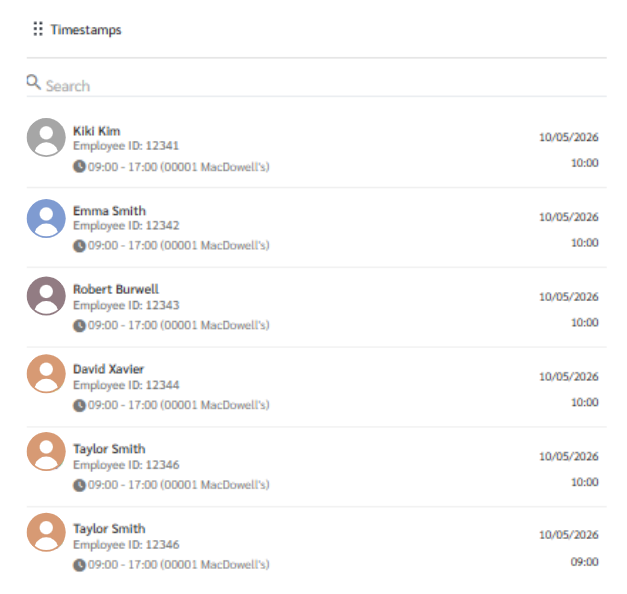
7. Timestamp Table
The Timestamp Table shows each sign-in and sign-out event as a separate record. Unlike the Timesheet Table which gives a daily summary per employee, the Timestamp Table is useful when you need to verify exactly when each scan happened especially when an employee has scanned multiple times in one day.
- 1 row = 1 scan event (Sign In and Sign Out appear as separate rows)
FAQ
- Why does the Leave card show fewer employees than expected?
= The Leave card counts full-day leave only. Employees on hourly leave still come to work that day and are counted as expected to work.
- How do I read the Headcount Summary, and why do the numbers sometimes look inconsistent?
= The summary shows three figures, for example: 92 / 100 · 10
- 92 = employees who have signed in
- 100 = employees expected to work (excludes full-day leave, Day Off, and Holiday)
- 10 = employees who have not yet signed in
Why is employees who have not yet signed in =10 when 100−92=8 ?
= Because 92 includes employees who signed in on a Day Off or Holiday. Those employees are not part of the 100 base, so the system counts "not yet signed in" directly from the 100 base rather than by subtraction.
The extra 2 in this example are employees who signed in despite having a Day Off or Holiday.
- Where can I see employees who signed in on a Day Off or Holiday?
= These employees are excluded from the Headcount Summary and KPI cards because they are not part of the expected-to-work group. Their sign-in records are still available in the Attendance Timesheet Table.